
90 years later:
Yesterday’s maps and today’s data
How Des Moines' redlined neighborhoods are affected by poverty today
BY KATE HAYDEN
One year after the 2020 public exhibit Undesign the Redline: DSM debuted at Franklin Junior High School, the borders of the original redlined map of Des Moines stands out in memory. It leads you to wonder: How are these neighborhoods affected today?
As the base map, the Business Record used the original 1930s Des Moines Securities Map created by the Home Owners Loan Corp., which developed a home valuation and mortgage risk assessment now known as redlining to structure racism and inequality into home loan assessments. This map was republished by Polk County Housing Trust researchers along with national and local histories of redlining during the 2020 public exhibit Undesign the Redline: DSM.
On the maps in this story, the Business Record highlighted neighborhoods in HOLC categories “C,” which HOLC defined as ‘fair’ risk, and “D”, which HOLC defined as ‘bad’ risk. Neighborhoods “A” (“best”) and “B” (“good”) are in gray. (Of note: The gray parcel of land between neighborhoods C6, C5 and D4 is the Iowa State Fairgrounds.)
Using public information from the city of Des Moines, the U.S. Census Bureau and data collected by the Des Moines Area Religious Council’s food pantry network, we wanted to see how some recent community initiatives are present in highlighted neighborhoods the HOLC deemed risky decades ago. We also reviewed visitor growth at DMARC pantries since 2012, and how the Census Bureau identifies school-aged children in poverty within their district borders.
This presentation is not enough to complete a picture of how redlined neighborhoods are affected today, but we hope to offer a different lens for businesses and organizations invested in understanding food assistance, poverty and redlining’s legacy in our city.


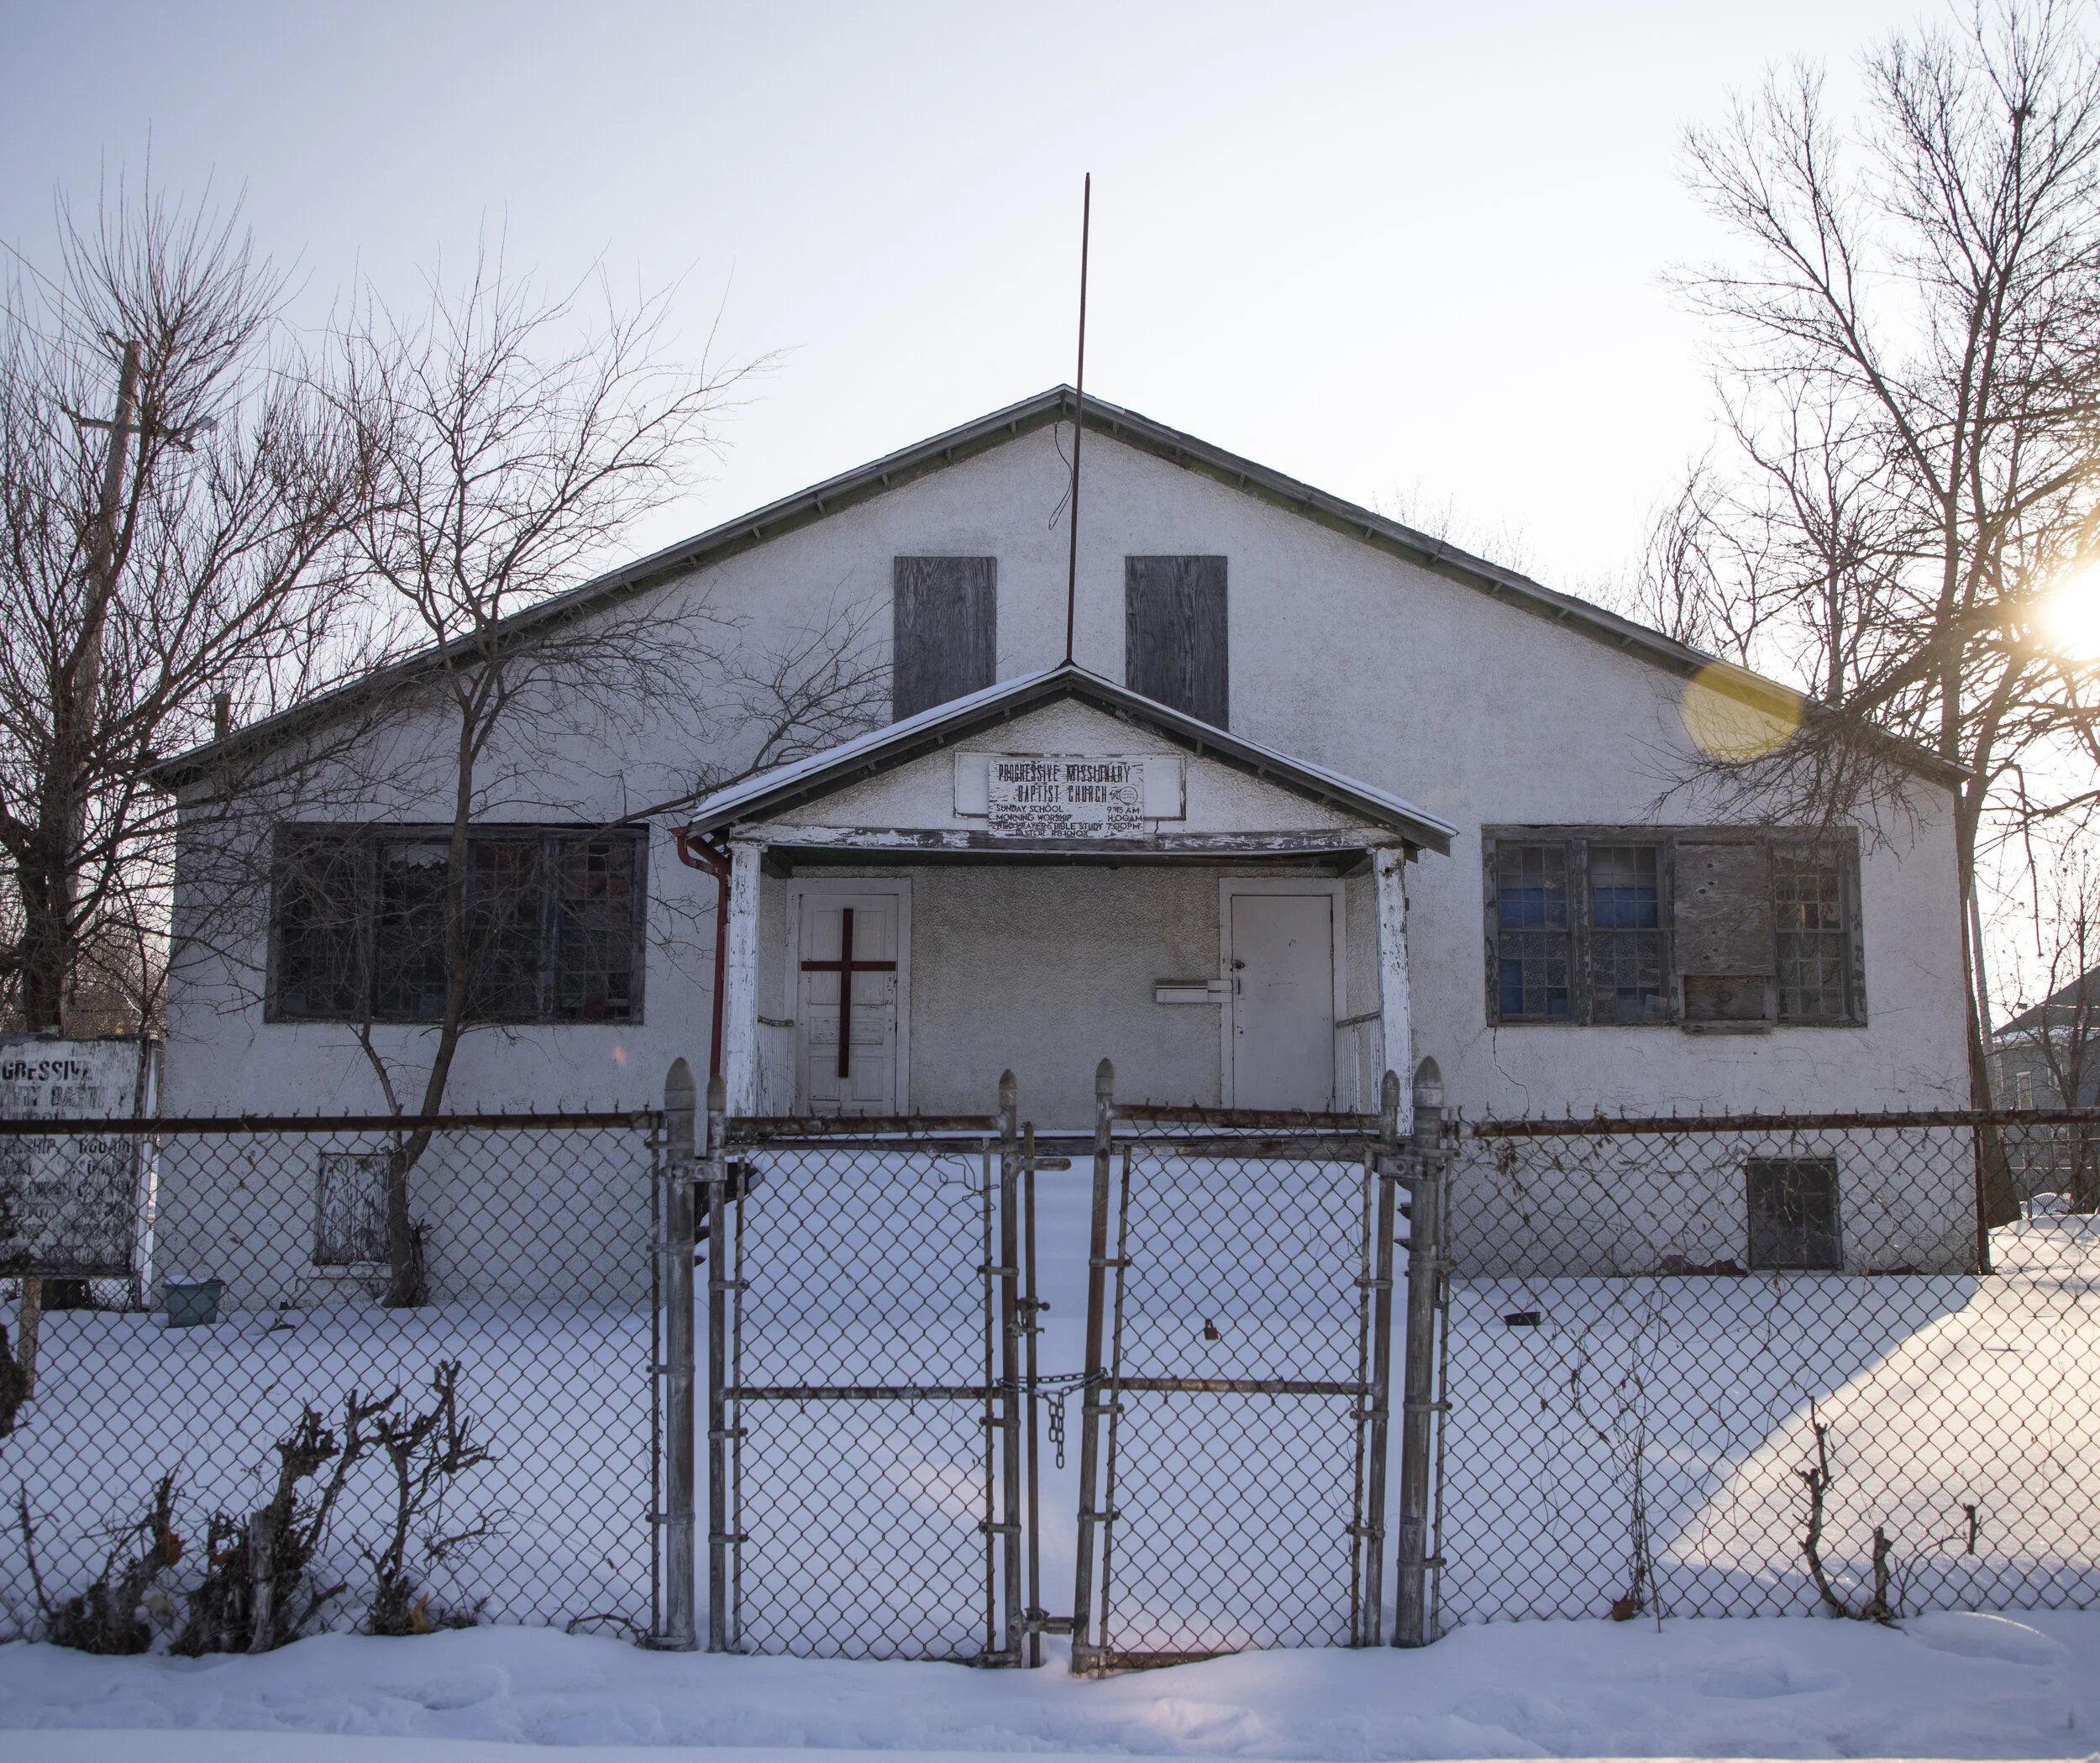
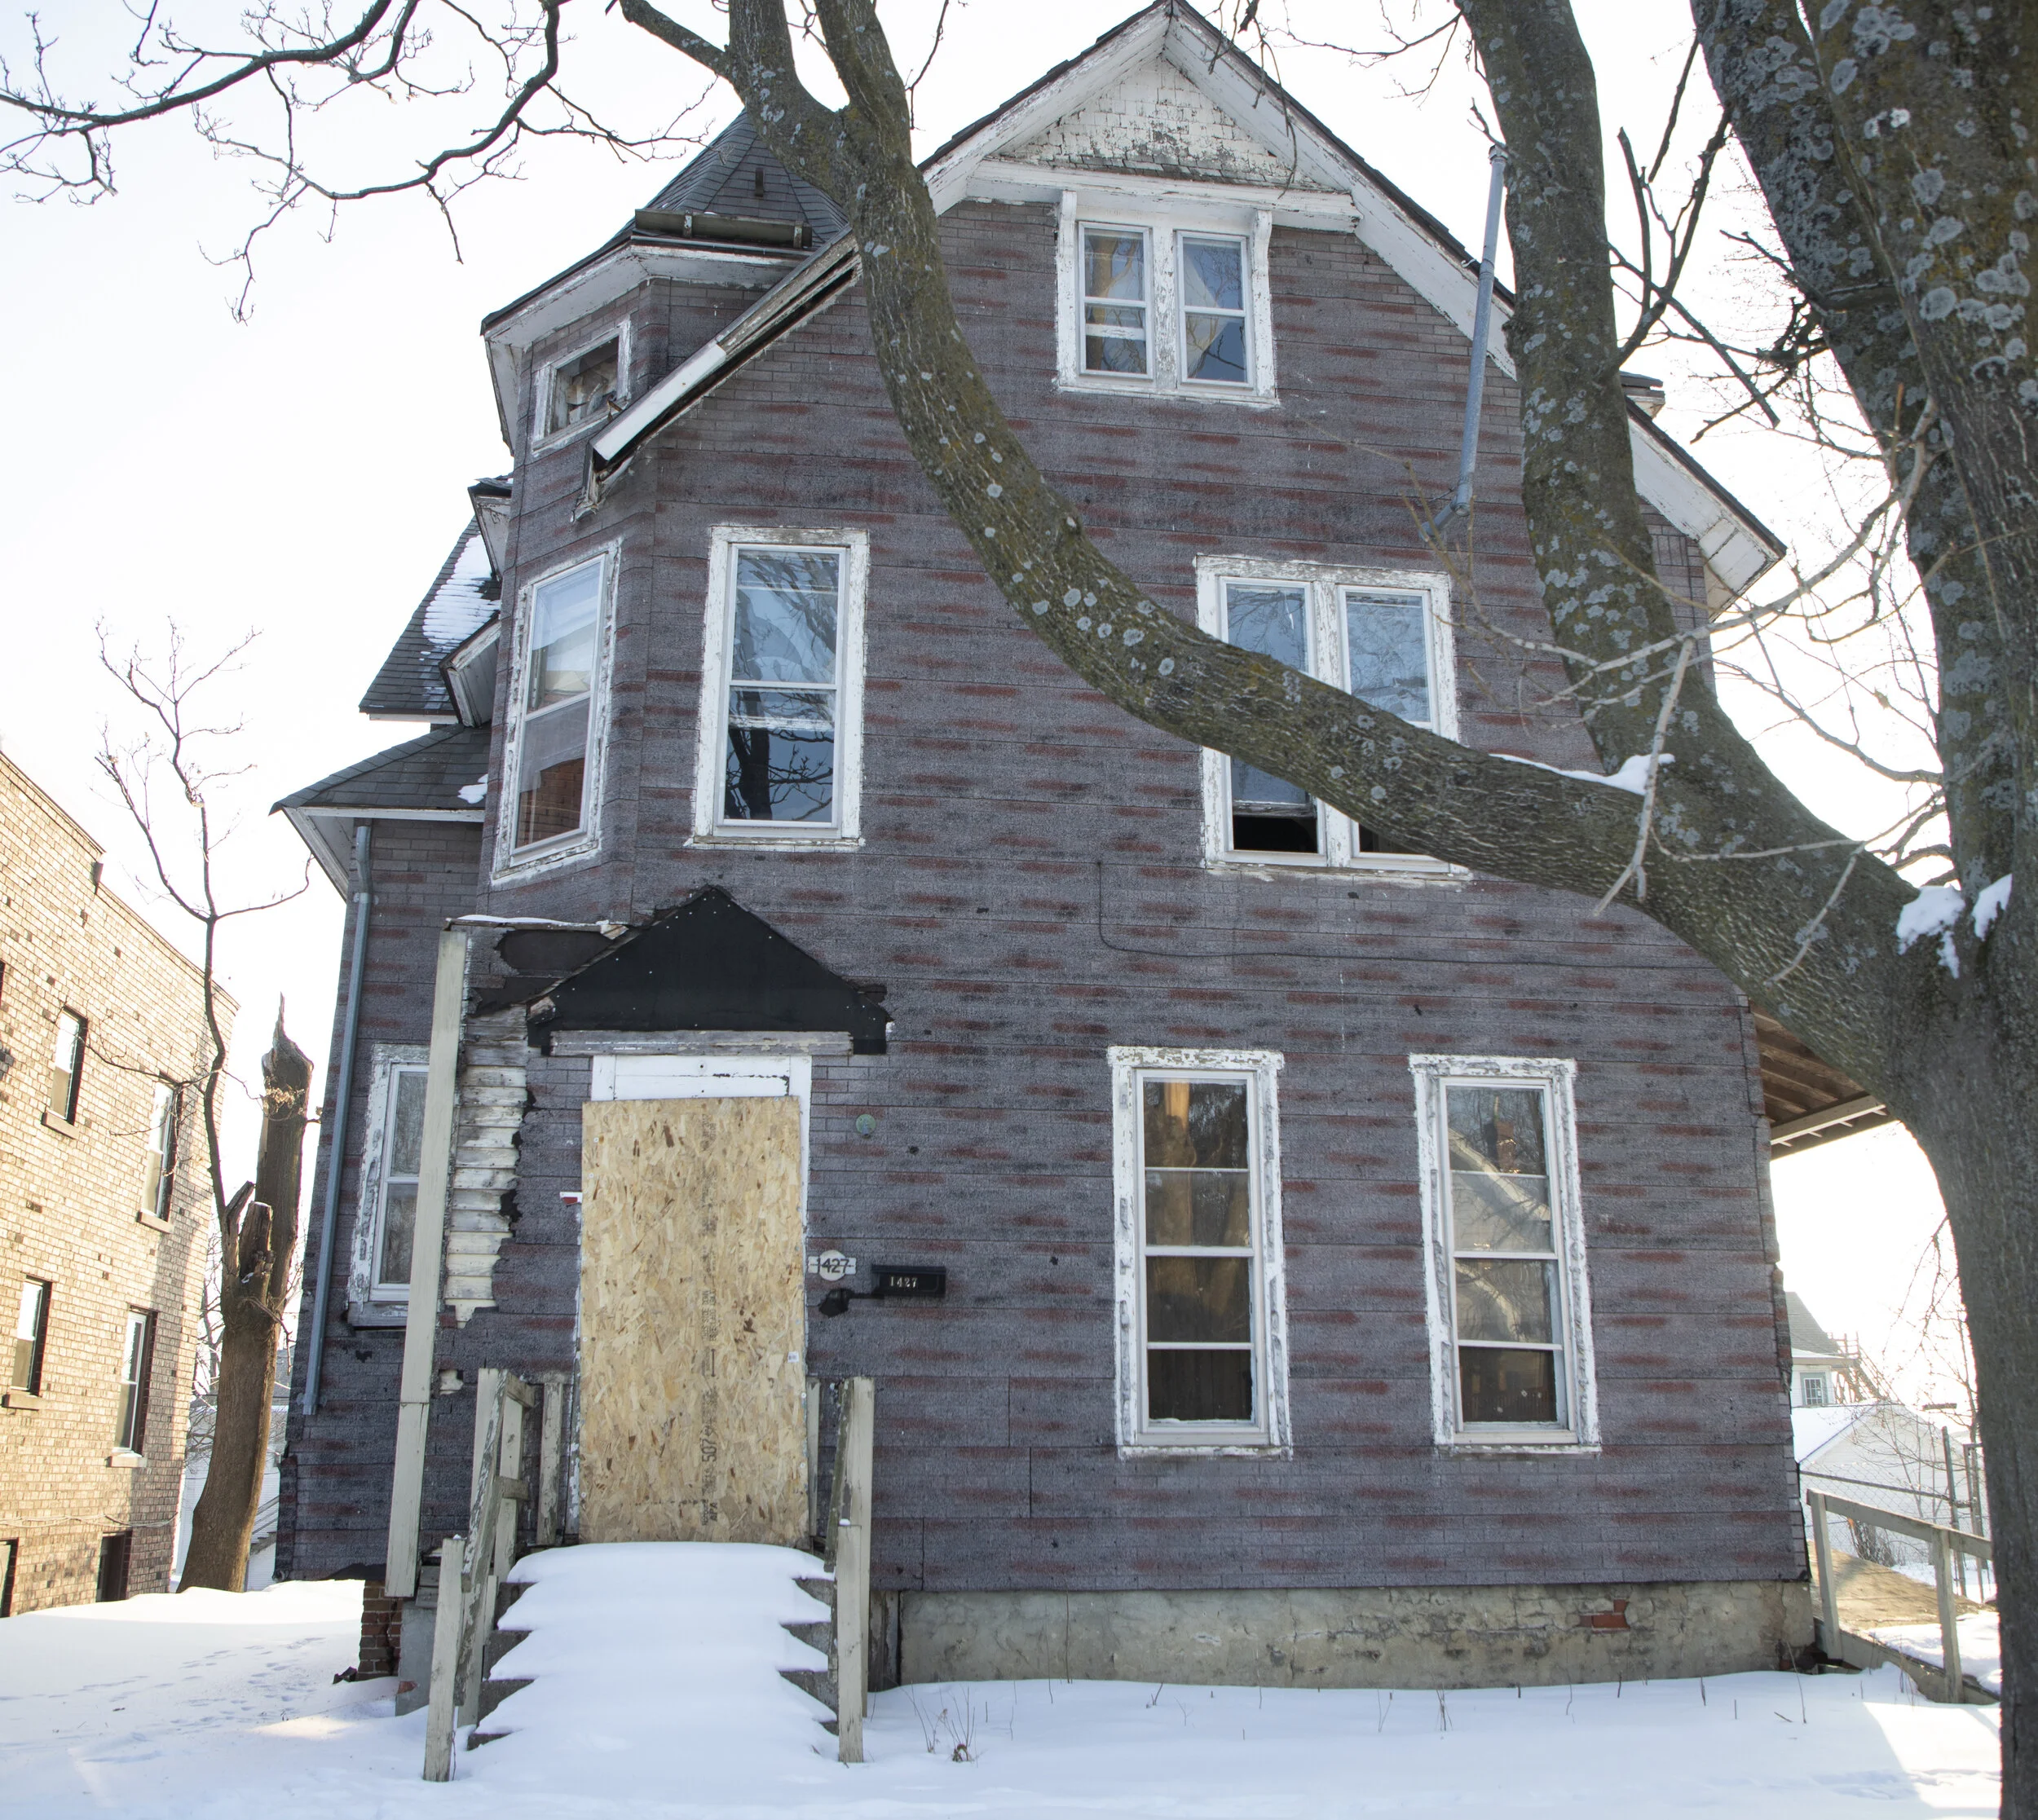

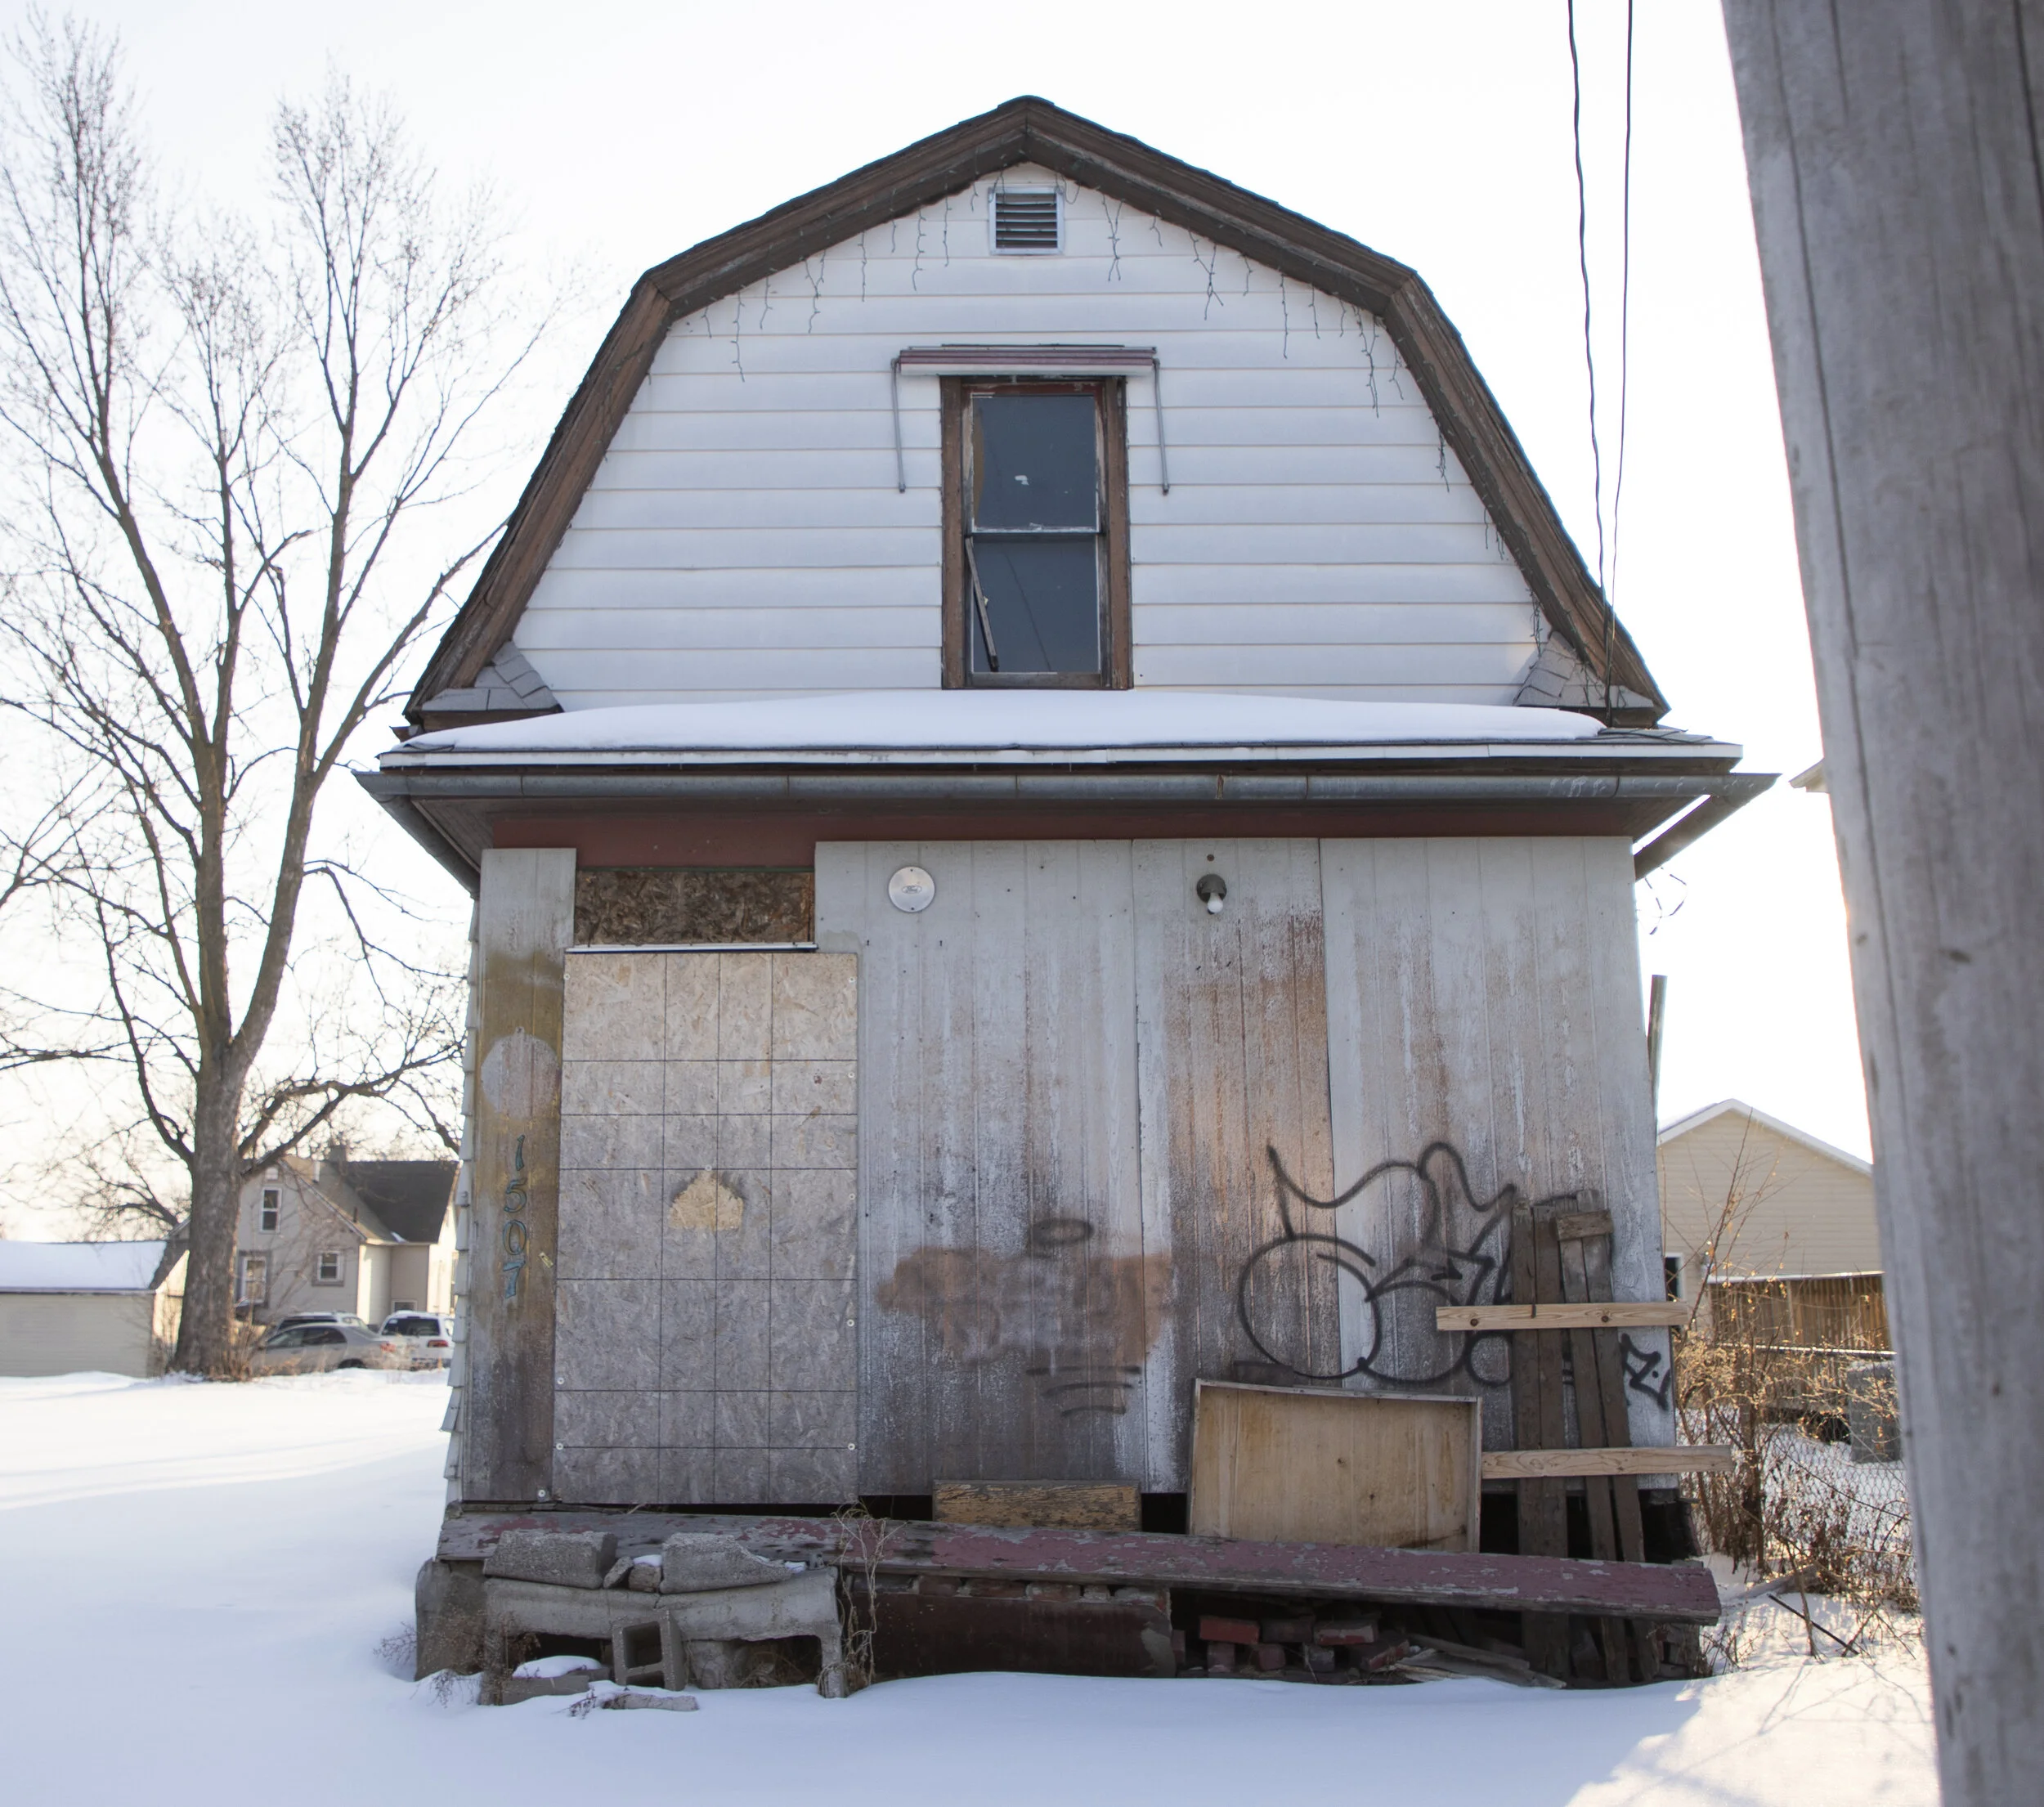
How neglected ‘nuisance properties’ align with redlining maps
Beginning in 2019, the city of Des Moines identified 237 blighted properties to target through the program Blitz on Blight, funded in part from $700,000 of local option sales tax collected in fiscal year 2020. Properties targeted must be declared a public nuisances by city government, meaning that property conditions are insufficient for resident occupation according to the housing code.
On the map above, each blue dot represents one structure targeted by the program. As of 2021, 56 of these addresses have been demolished at an estimated cost of $1,422,870. Although the program reviews properties across the city, most addresses declared public nuisance (published online at bit.ly/3dqtNzn) are condensed in neighborhoods redlined by the original HOLC maps.
In 1938, HOLC wrote in the map description that the properties in neighborhood C-2 averaged 30 years old, and some large homes were being converted into duplexes and apartments (bit.ly/2No1E11). The blue dots located between neighborhoods D-1 and C-6 are concentrated in what HOLC defined as the Highland Park District, or B-1.
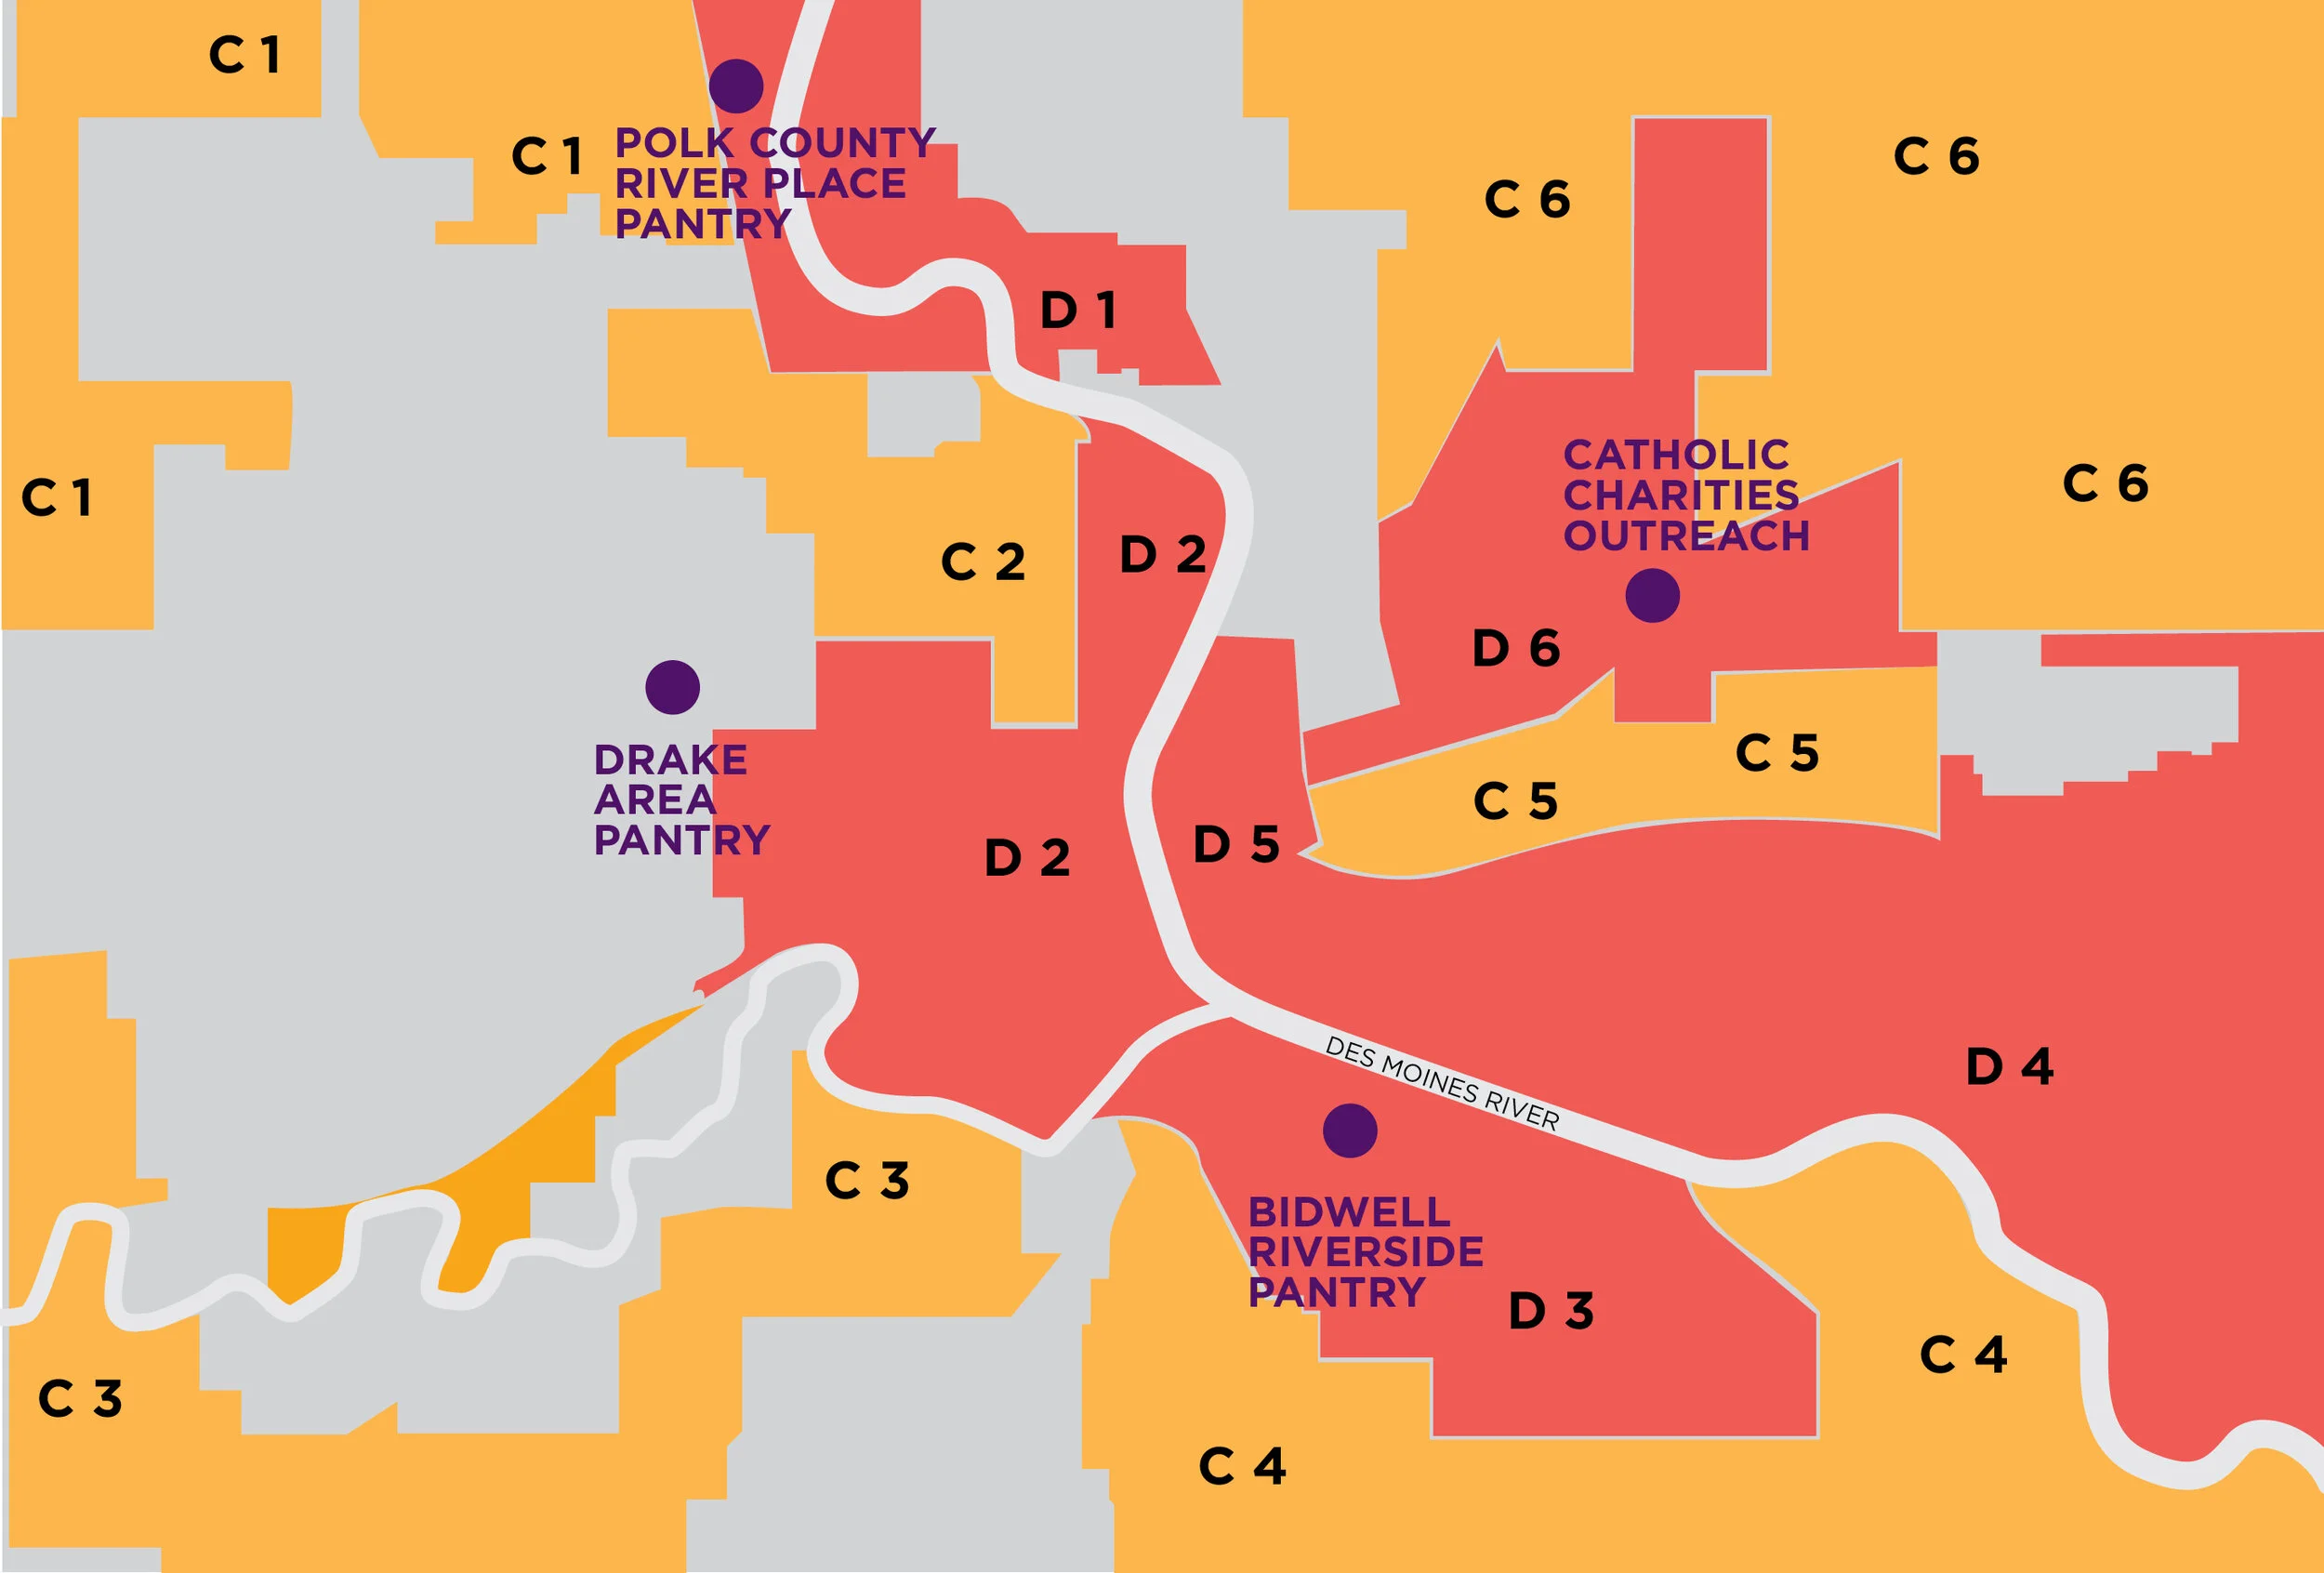
DMARC: Who in the community needs food assistance?
The Des Moines Area Religious Council launched the first location in its Food Pantry Network in 1976, but it was not until DMARC launched its own data dashboard project in 2012 that the organization and its affiliate partners could see connections between location visits, client demographics and other context.
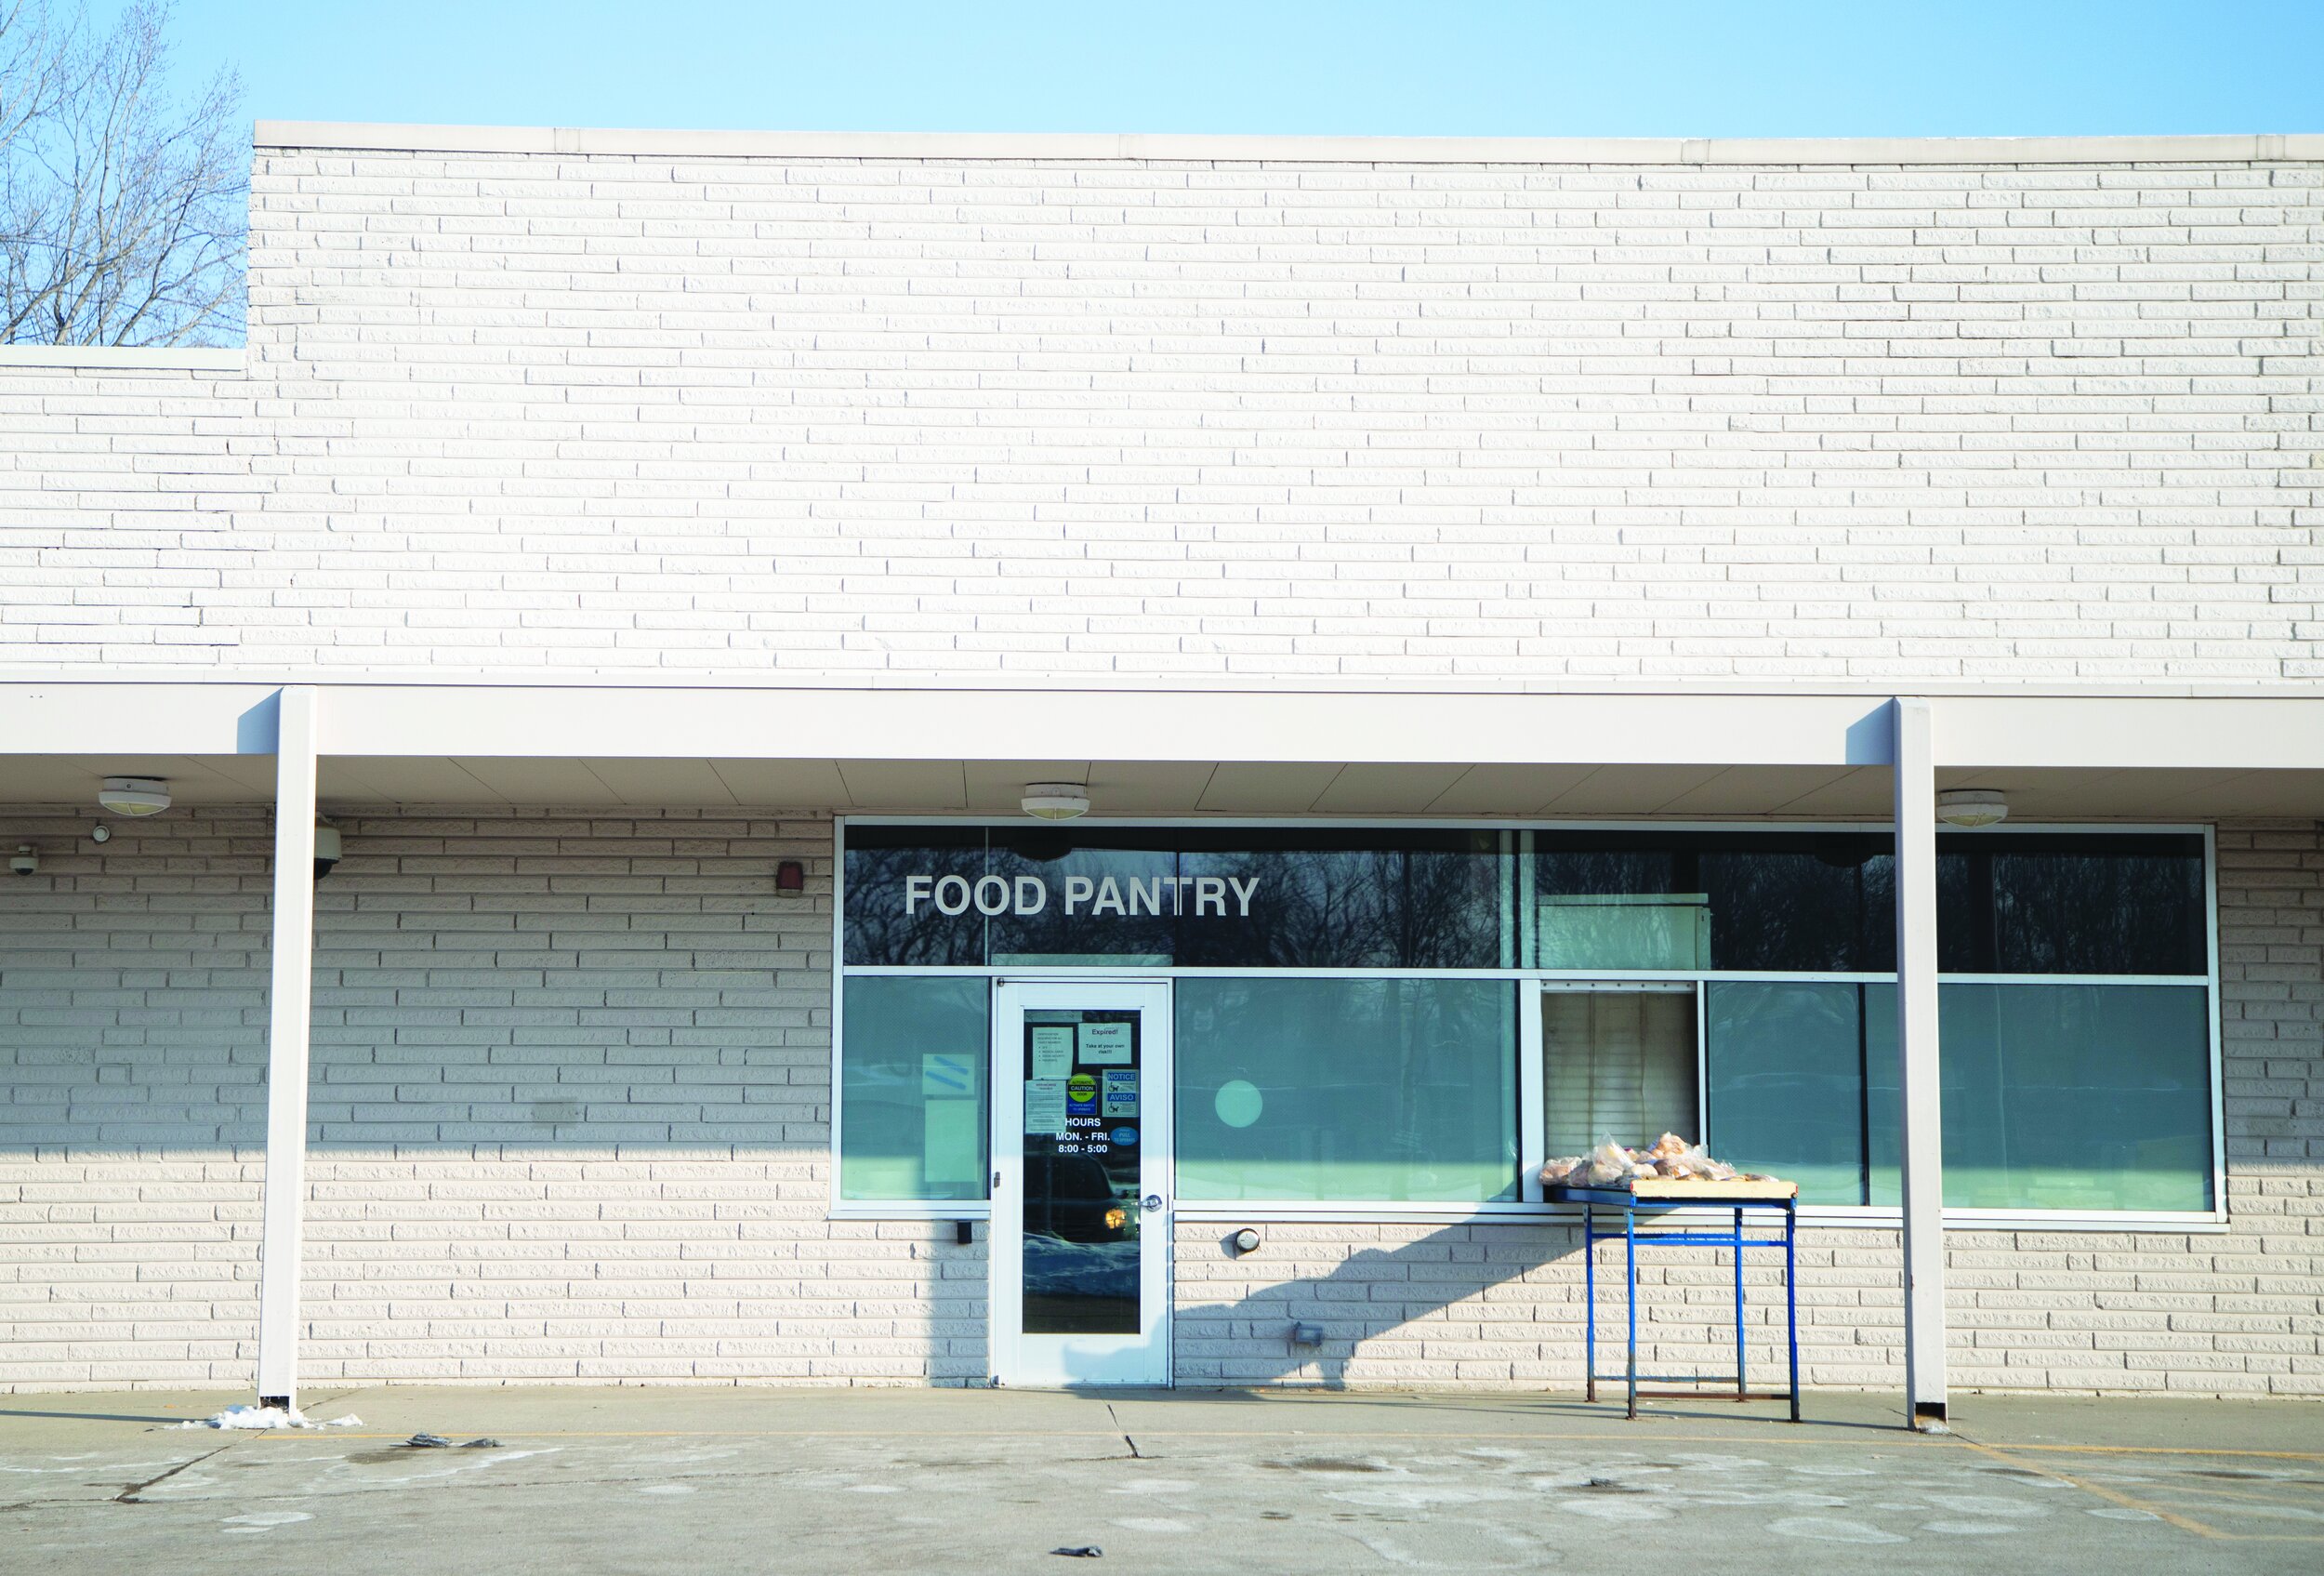
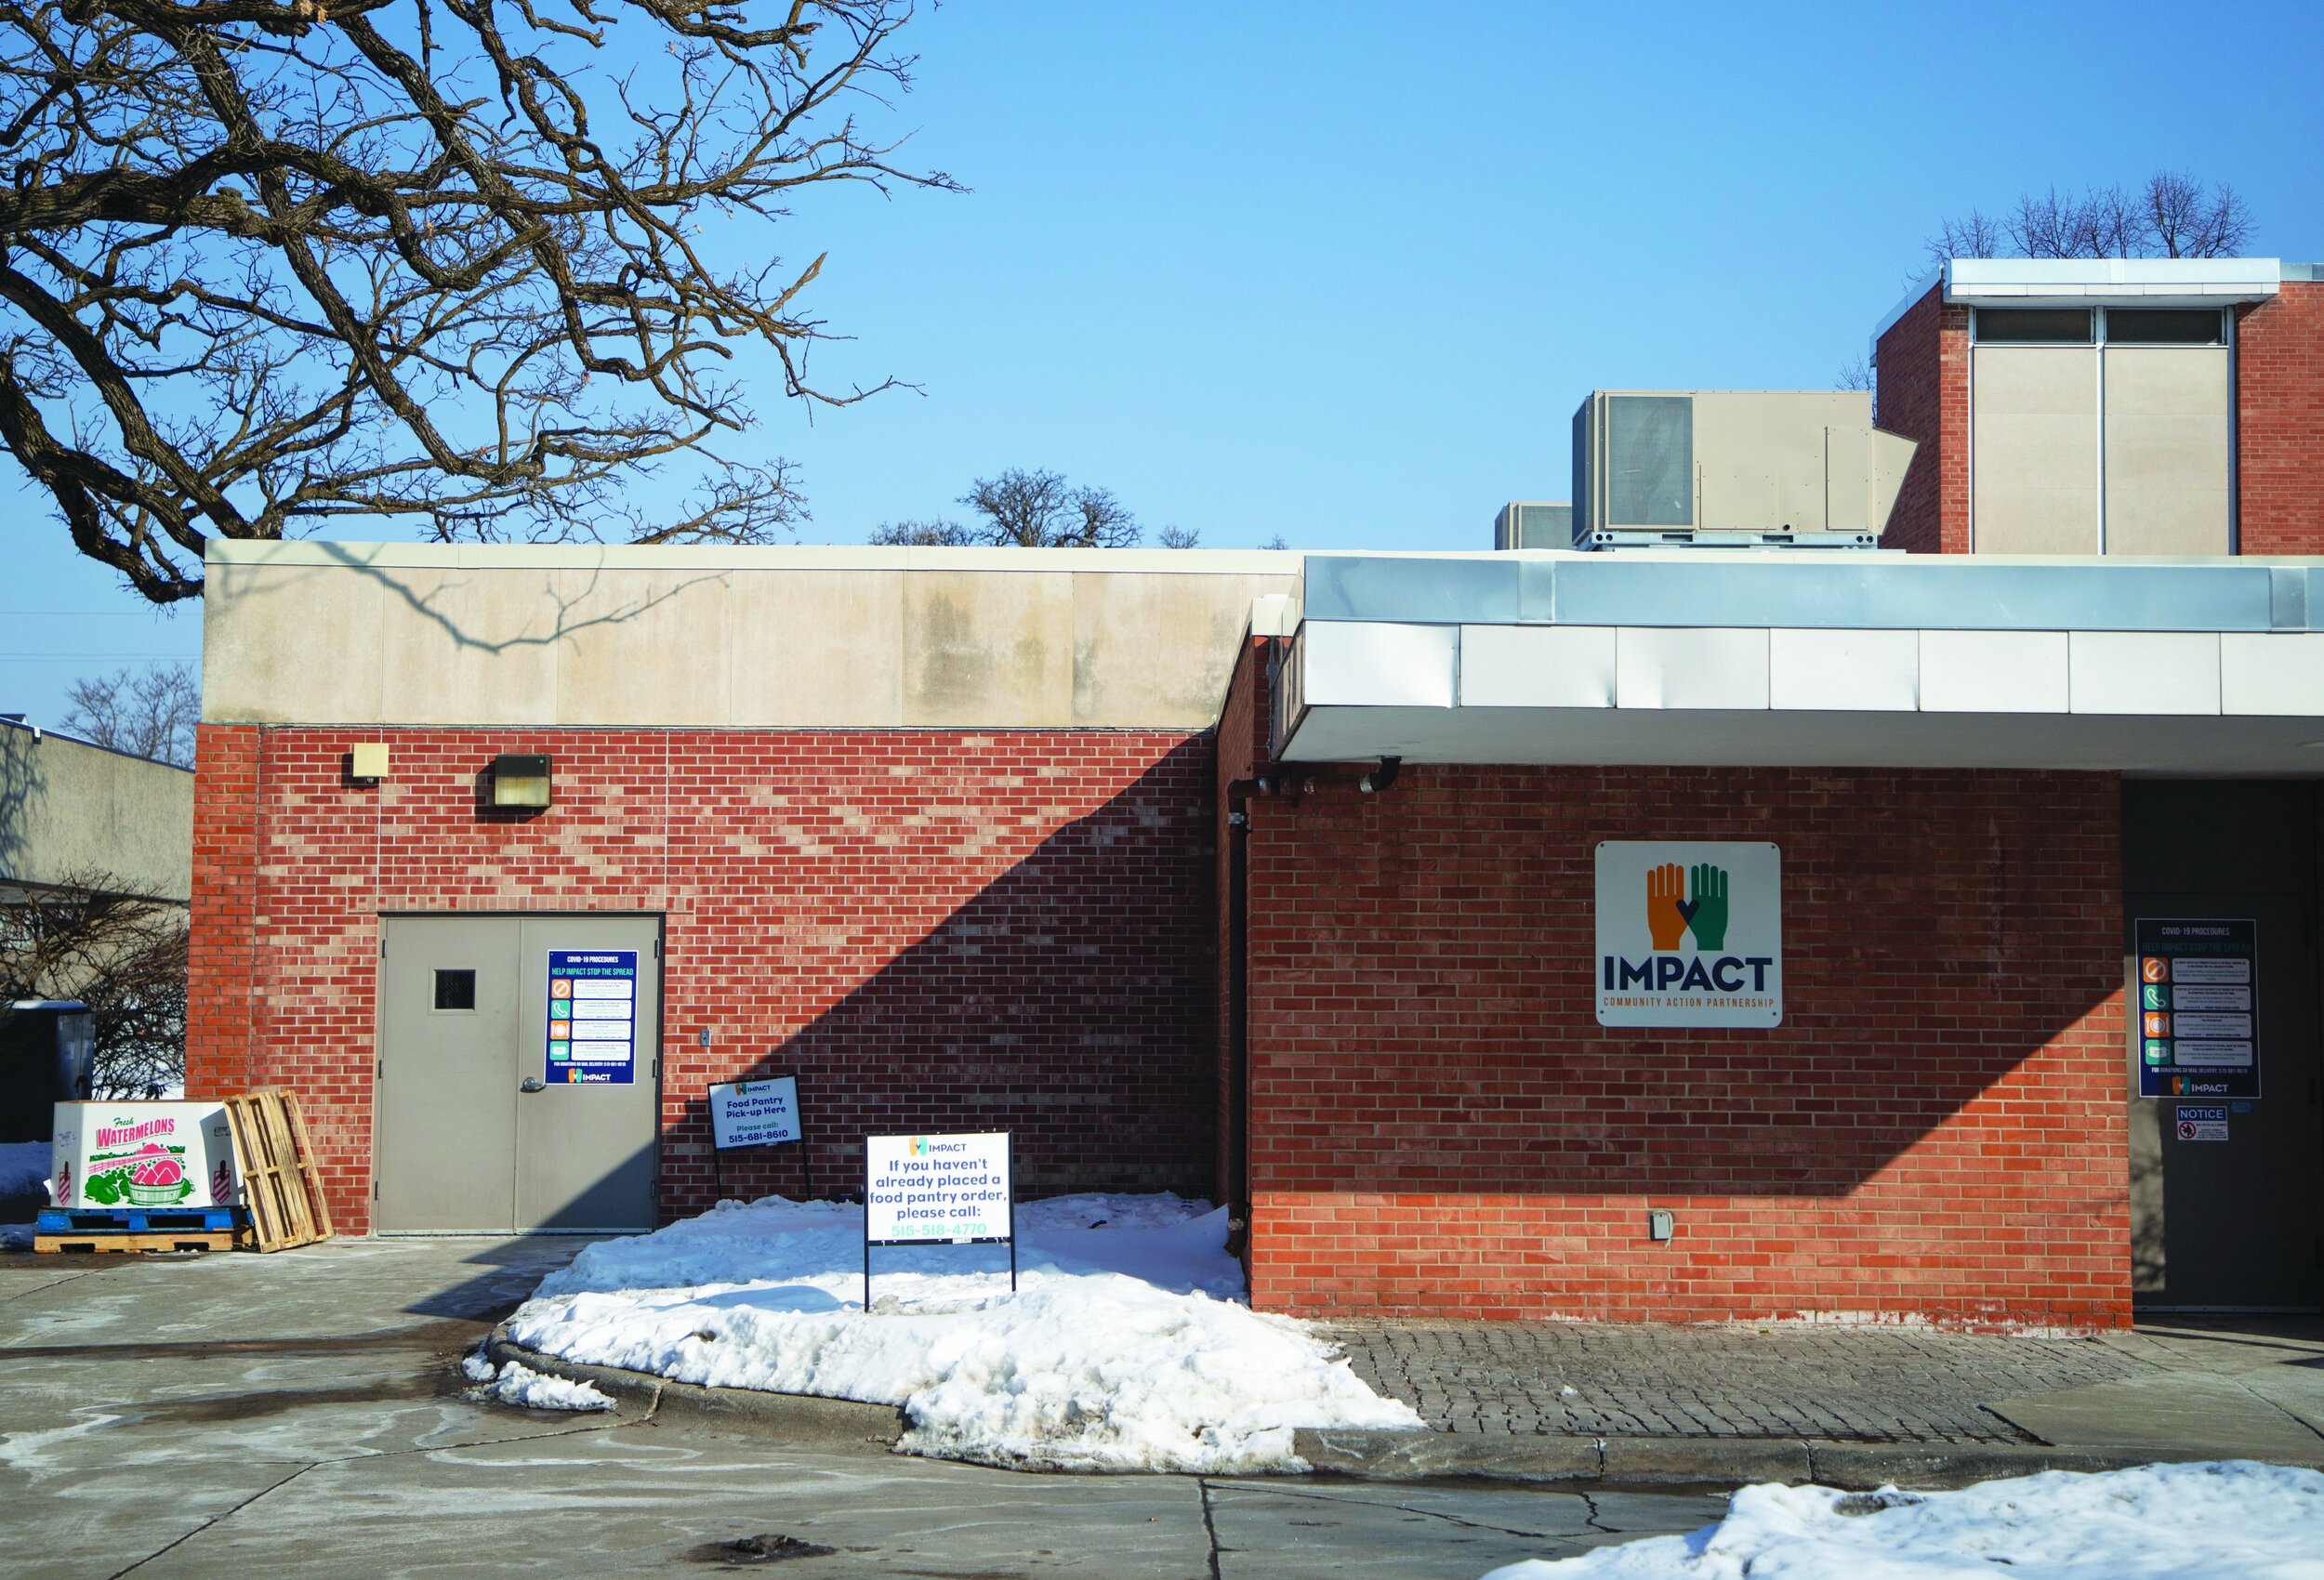
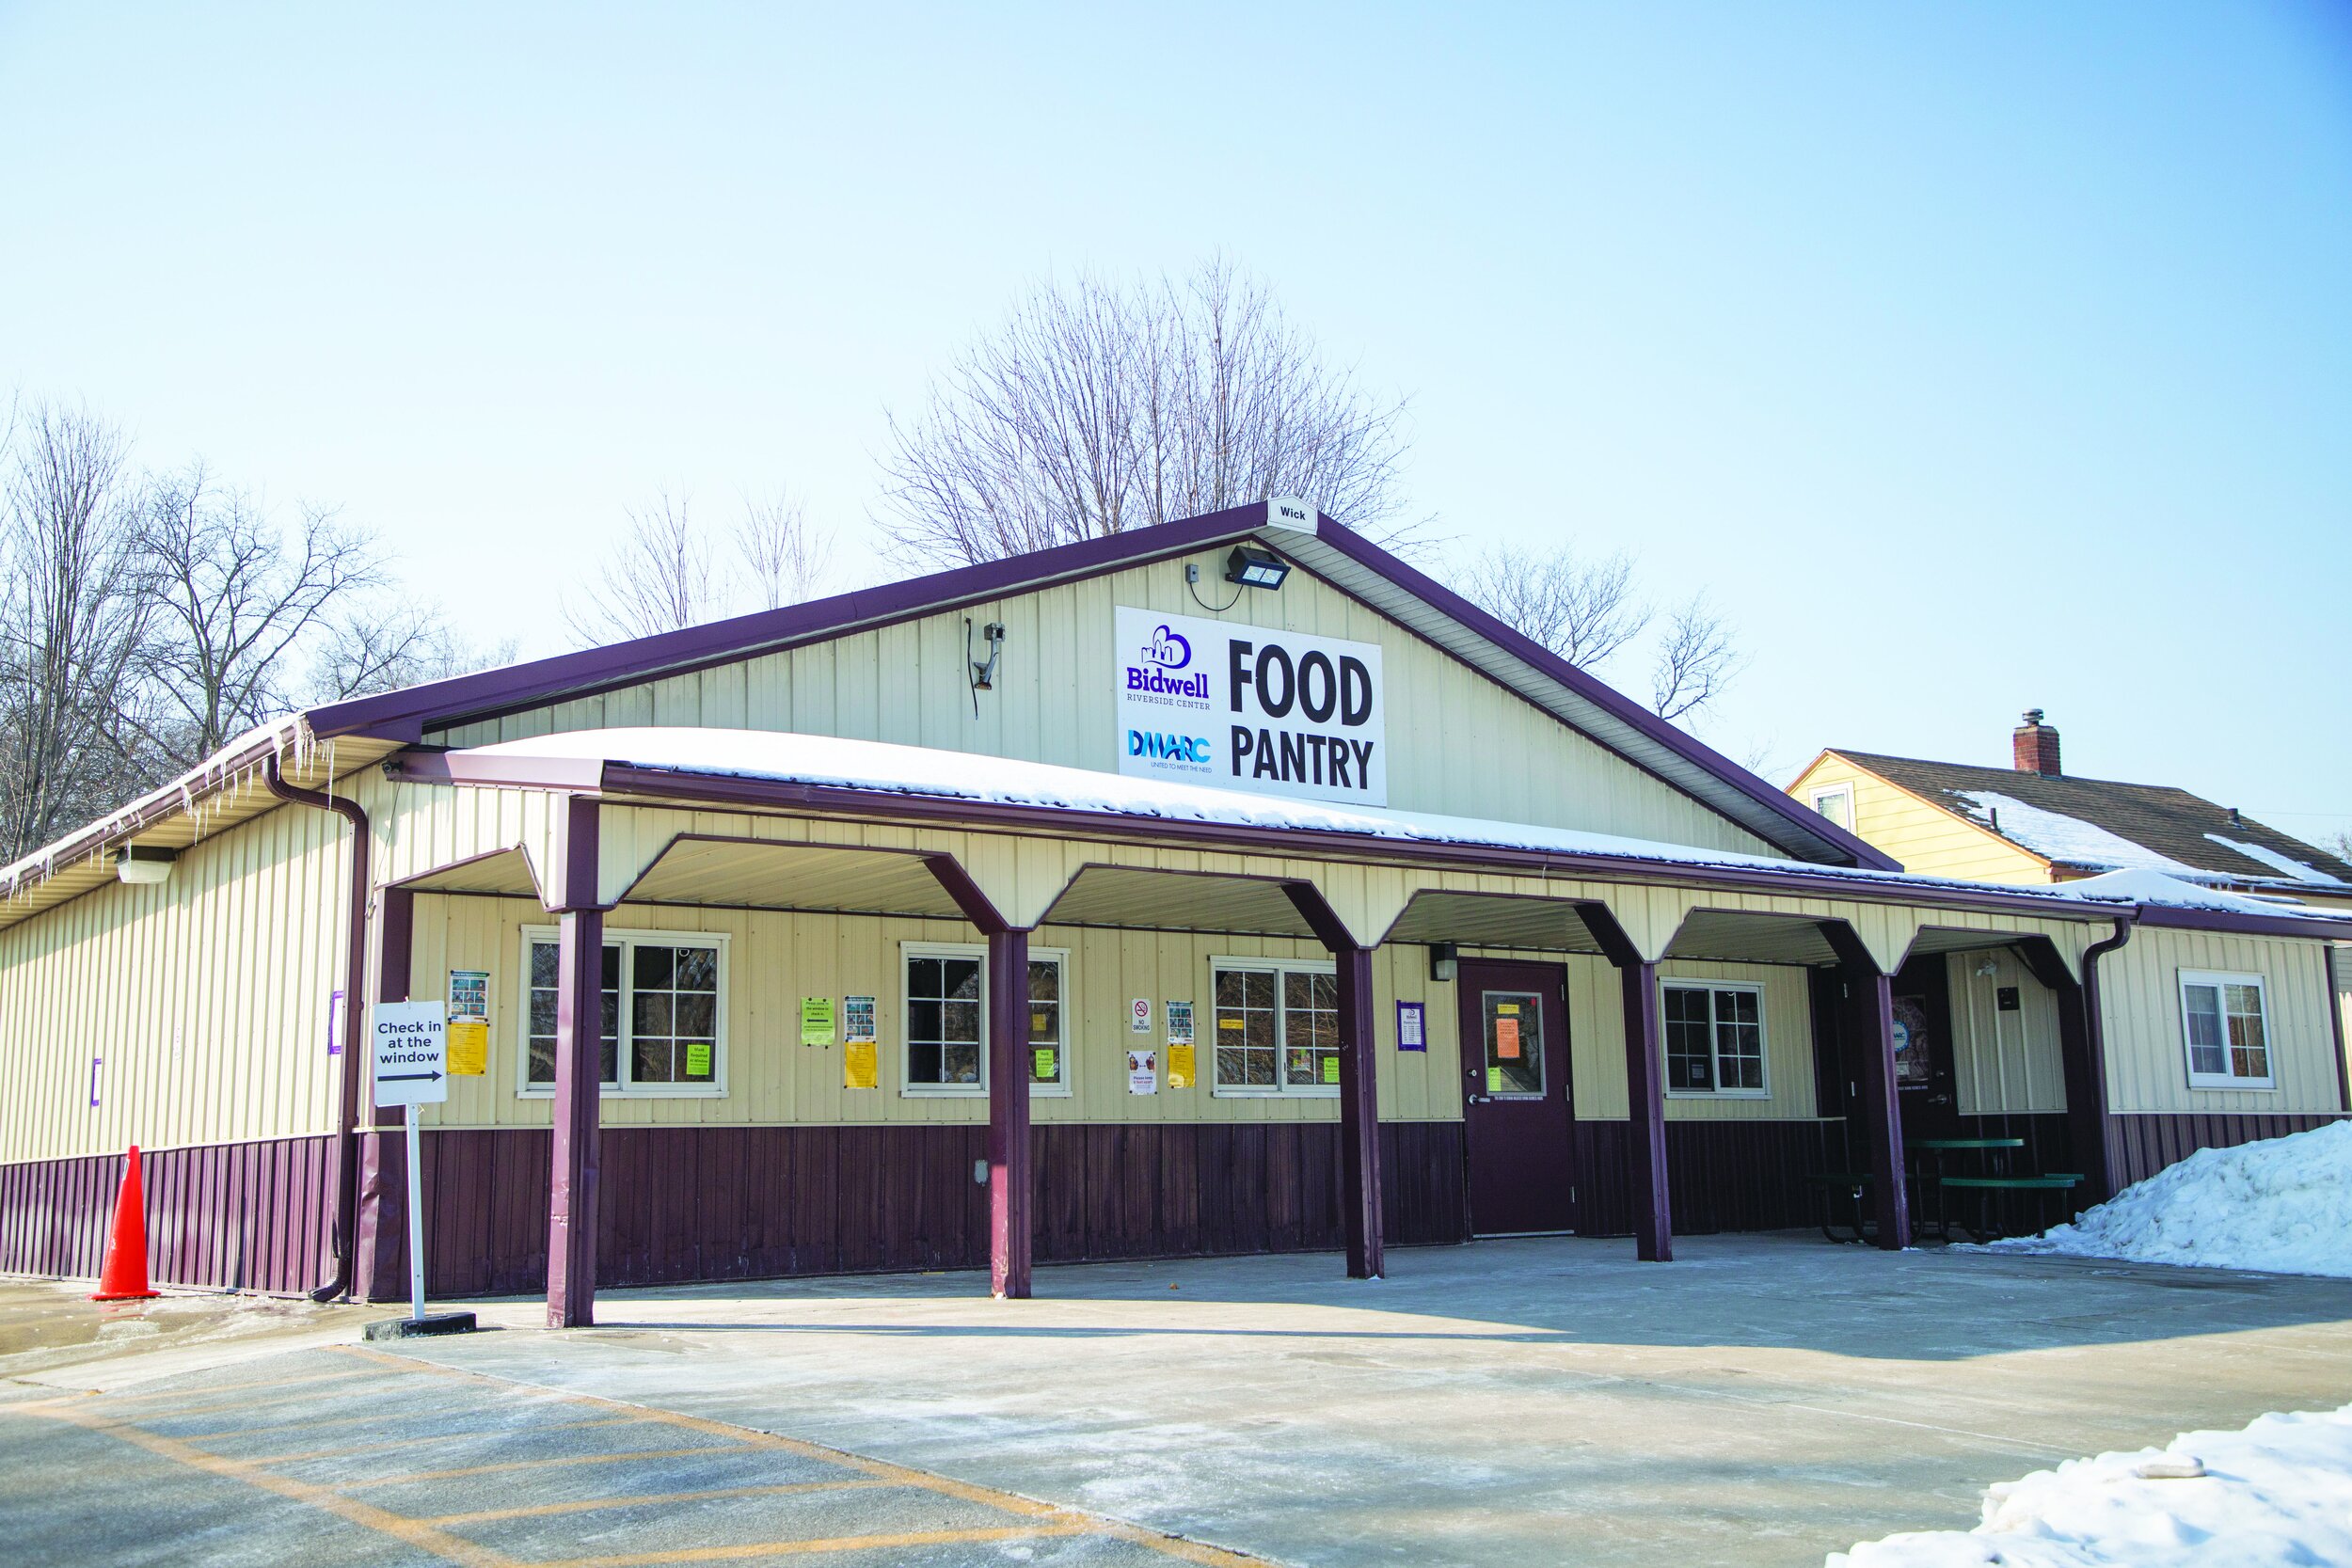
Above, DMARC’s four most-visited pantries are Bidwell Riverside, Drake Area Food Pantry, Polk County River Place and Catholic Charities Pantry. DMARC Mobile locations are the network’s fifth-most used pantry locations, and DMARC keeps an updated schedule of the trailer’s appearances at 31 potential locations online.
Data collected by DMARC-affiliated pantries uses the race and ethnicity standards set by the U.S. Census Bureau and U.S. Department of Housing and Urban Development, which designates ethnicity options as Hispanic/Latino or Non-Hispanic/Latino. The analysis, seen in the map above, shows that these highly used pantries are in or near neighborhoods that were redlined.
While the majority of clients served are white, the data shows people of color are disproportionately affected by food insecurity as they make up a larger portion of DMARC clients served than within Des Moines’ population.
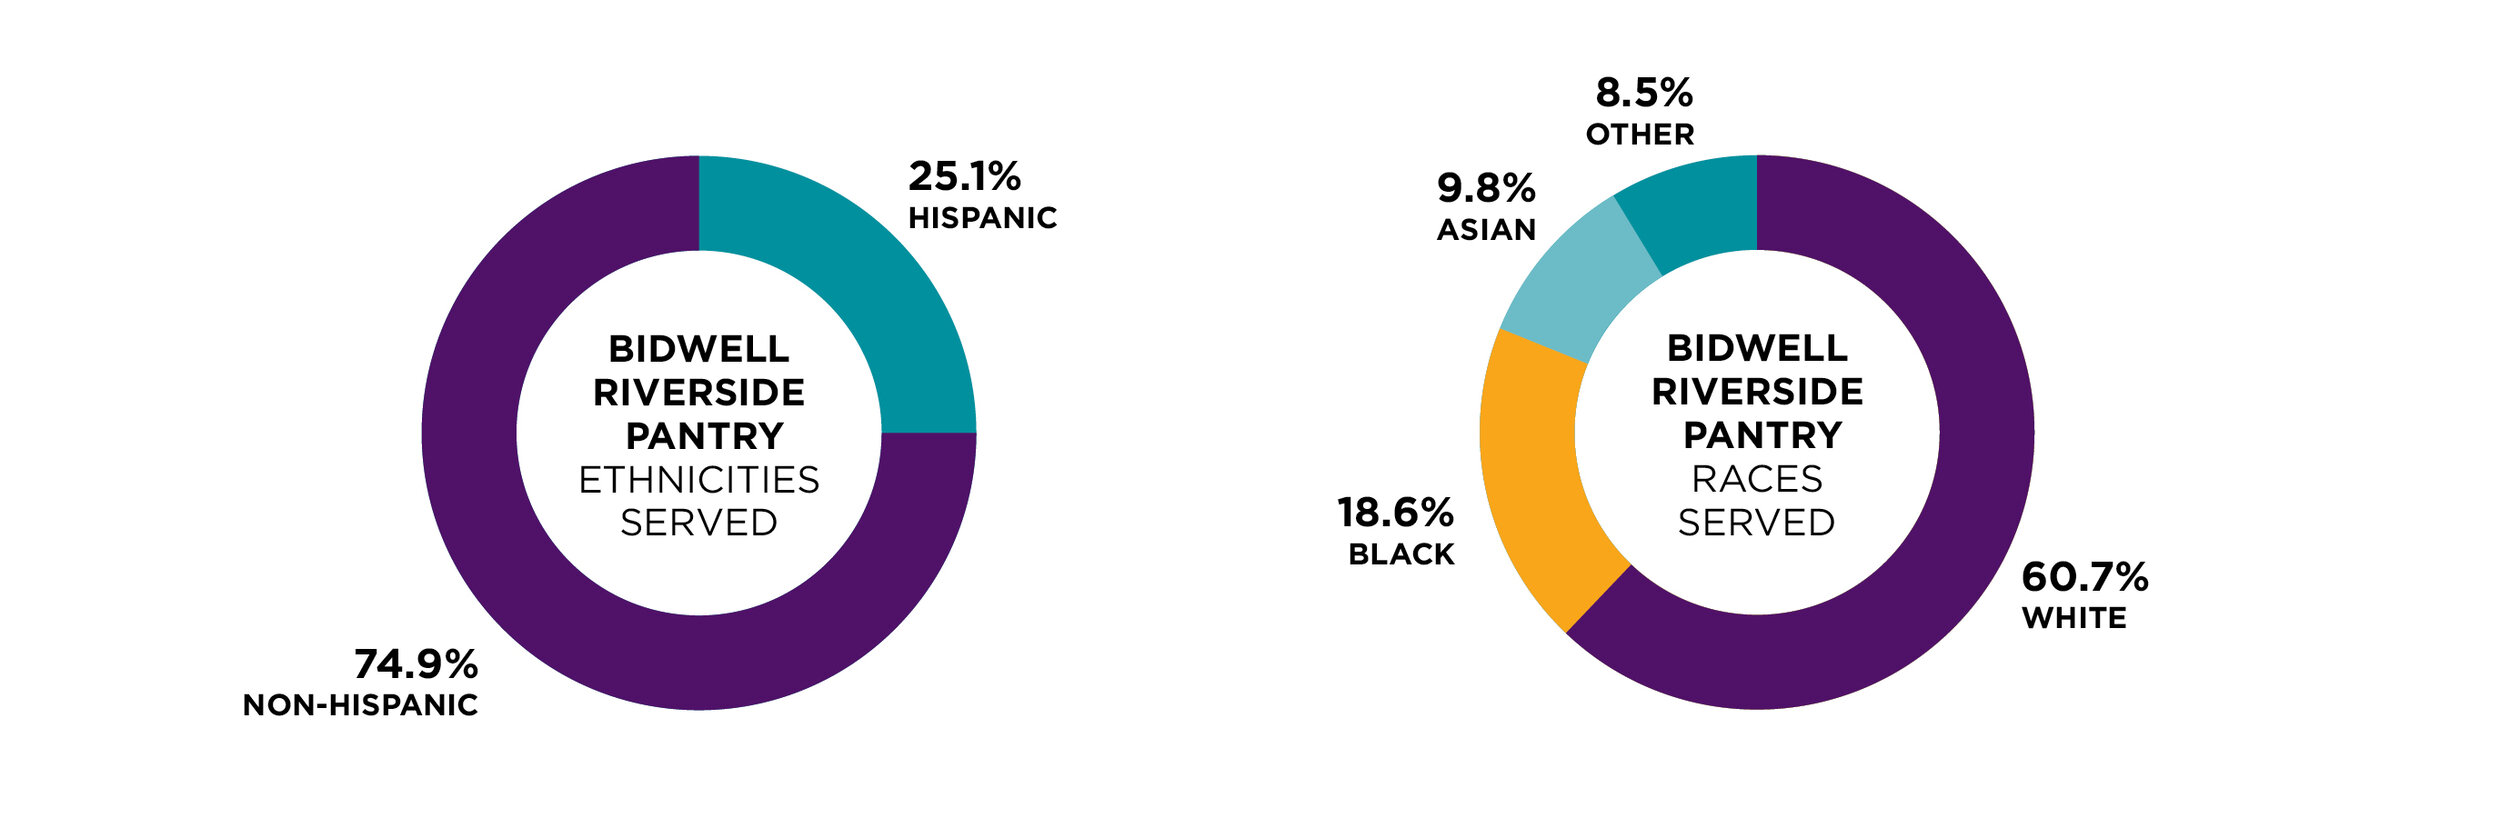
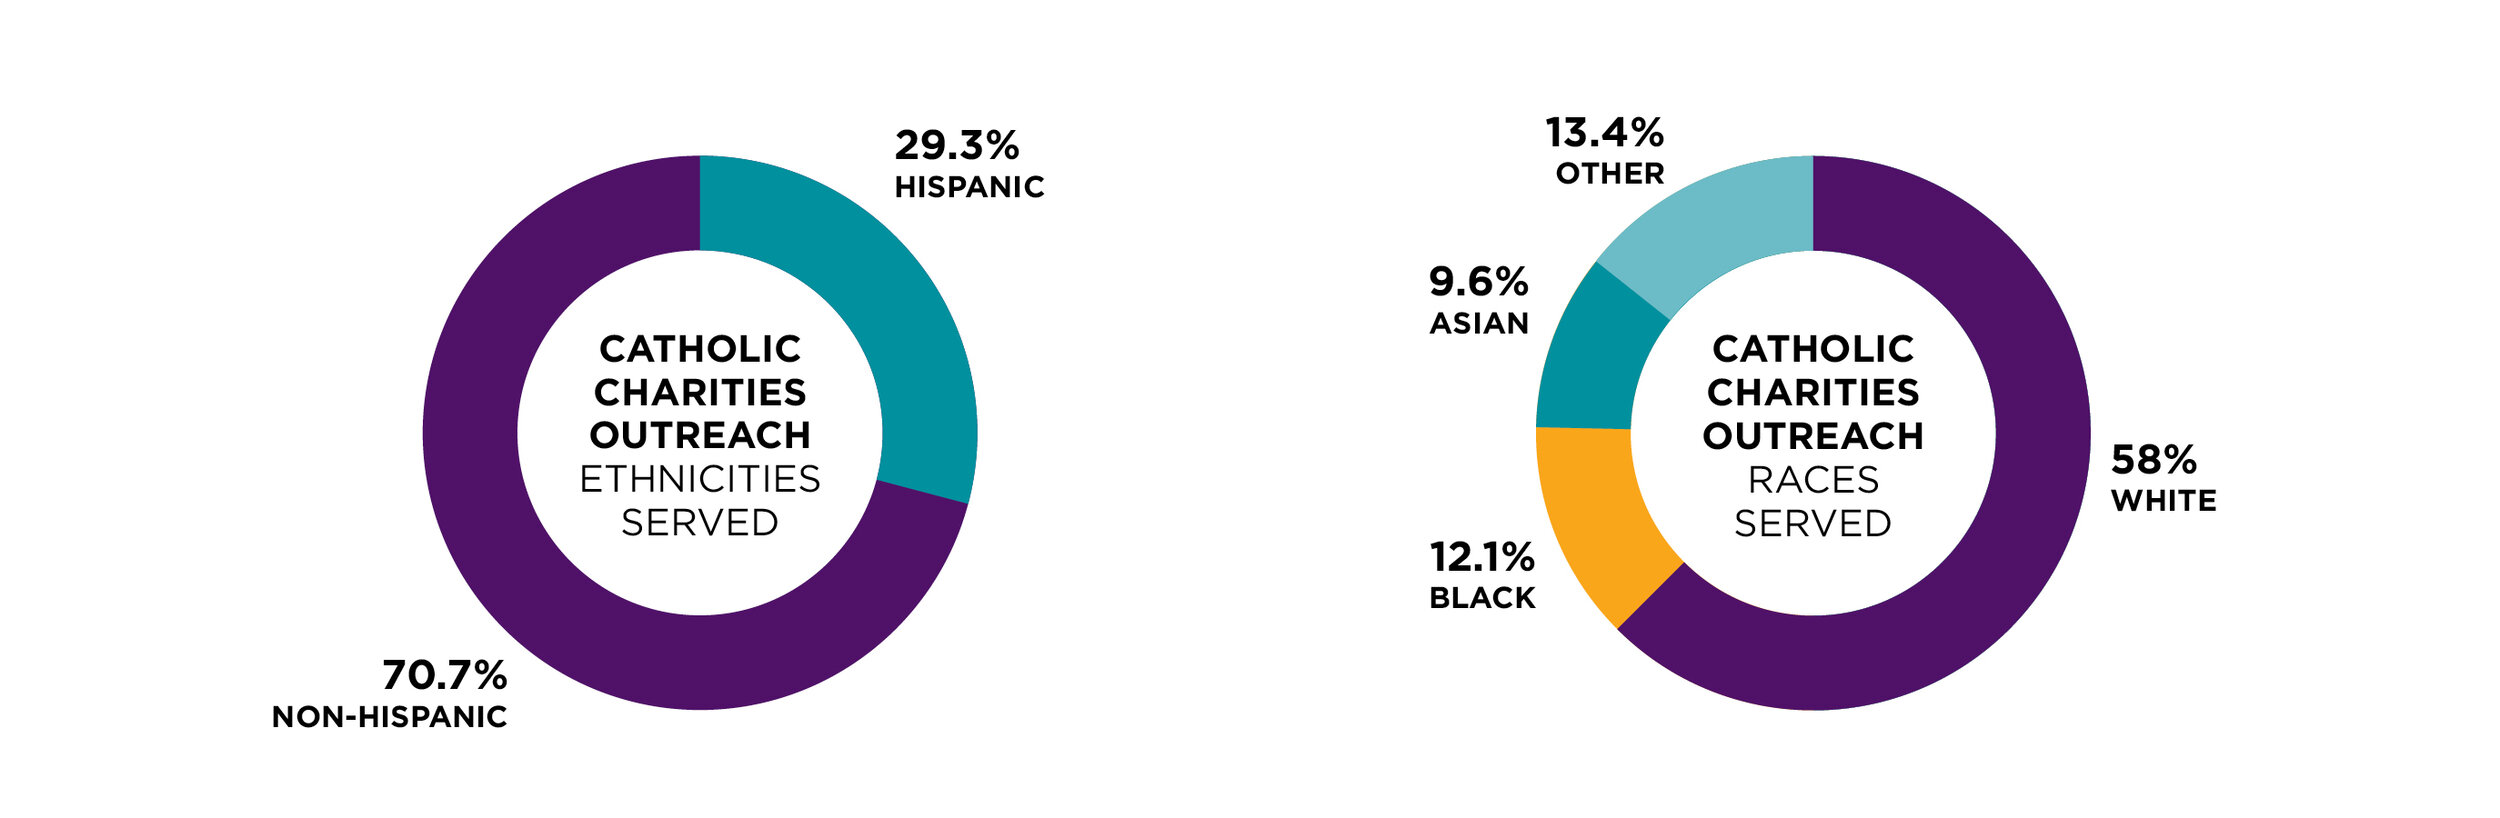
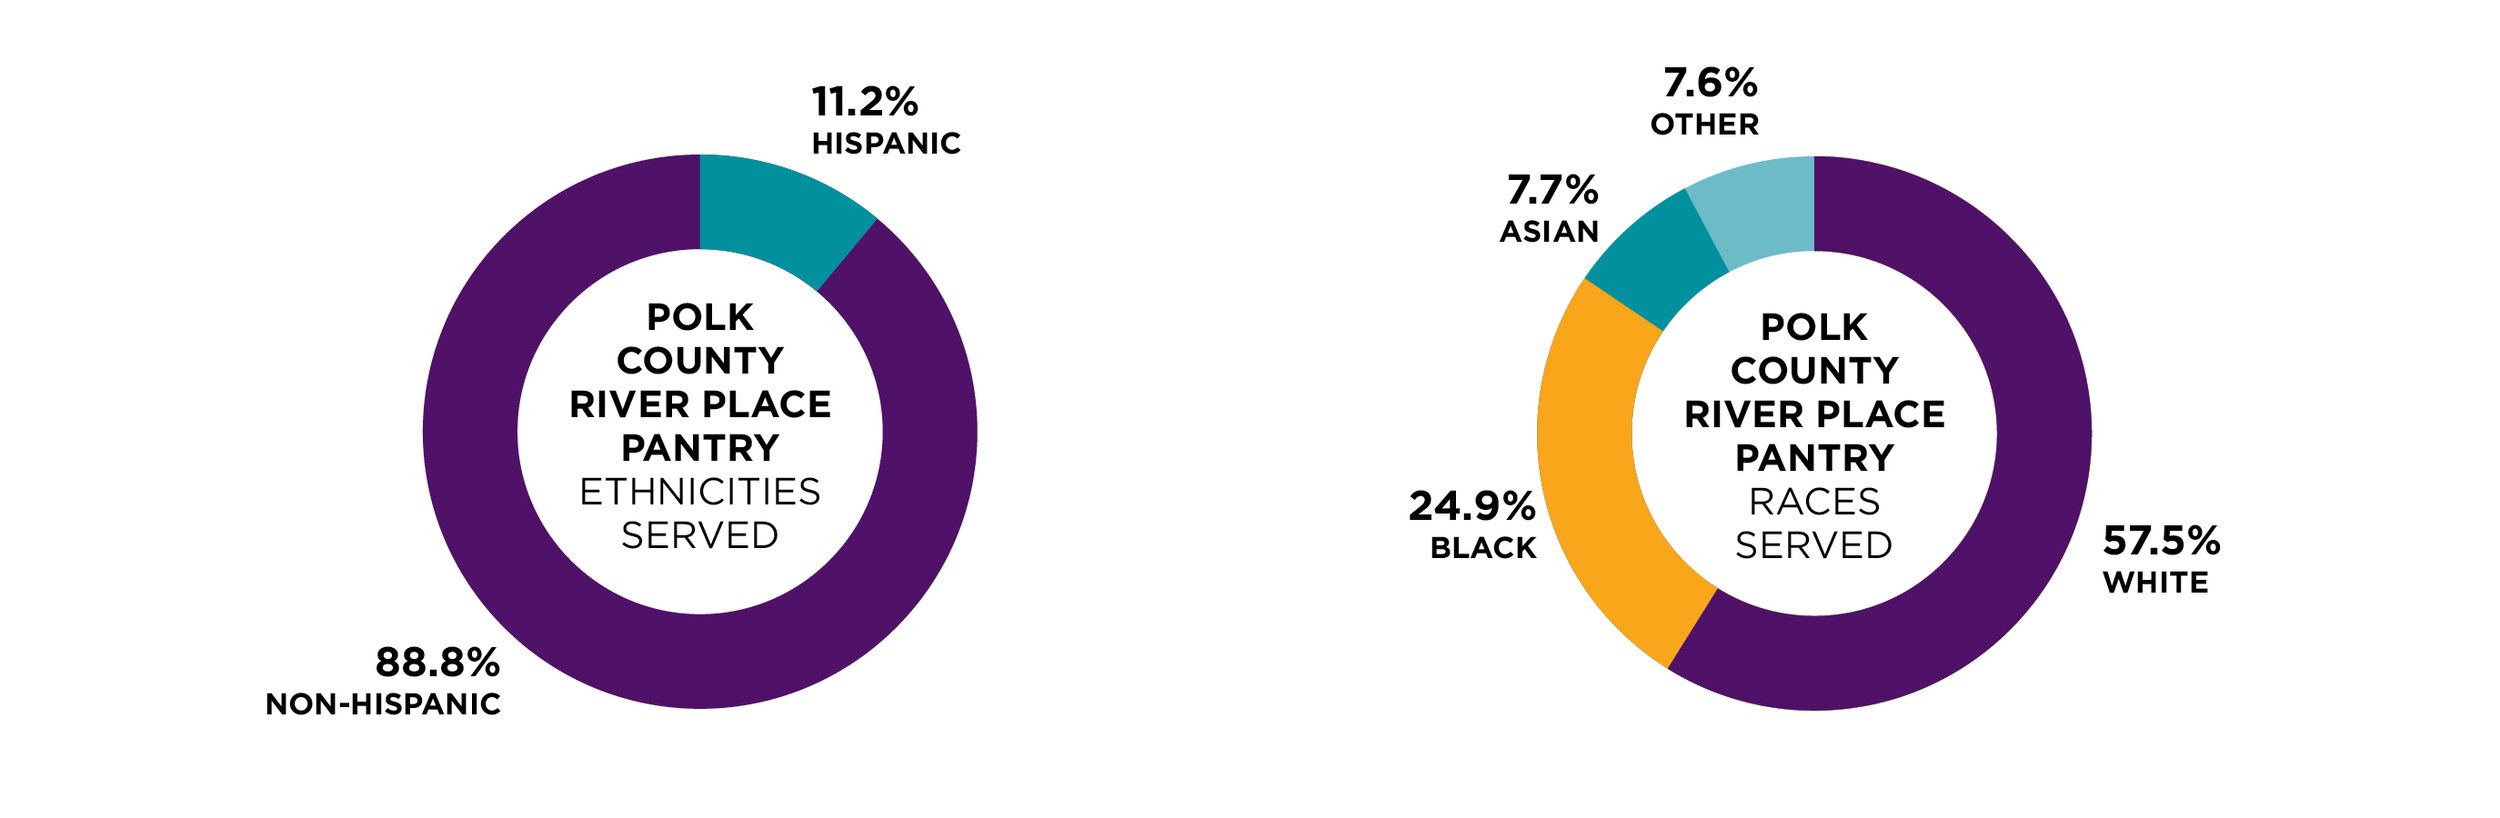


Categories in the “Races Served” charts on the following pages include the top four fields. HUD categories Native Hawaiian/Pacific Island, American Indian/Alaskan Native and Unknown are not included.

DMARC watches steady growth of neighborhood food pantry visitors
Since launching DMARC’s data collection initiative, the nonprofit has tracked a year-over-year growth in client visit counts across its Central Iowa network. 2013, the first full year on record through DMARC’s data dashboard, counted 22,828 unique individual visitors to DMARC pantries in Des Moines city locations. By 2018, DMARC reported 30,933 unique individual visitors to Des Moines pantries, making up about 76% out of the food pantry network’s total 40,522 visitors.
In 2020, the first year the COVID-19 pandemic and accompanying economic recession affected Iowans, the DMARC Food Pantry Network tracked another edge up in individual visitors: 31,781 to Des Moines pantries, about 77% of the network’s total 41,041 visitors.

U.S. Census reported downward trend of Des Moines community school children in poverty pre-pandemic
The estimated number of school-aged children living in poverty within district borders of the Des Moines Independent Community School District has declined since 2013 even as the general population within the district grows, according to the U.S. Census Bureau’s Small Area Income and Poverty reports from the last few years.
However, the most recent data available from the U.S. census comes from Jan. 1, 2020, using school district boundaries from the 2019-2020 school year. That precludes families financially affected by the 2020 COVID-19 pandemic and economic recession.
In a study released in December 2020 by United Ways of Central Iowa, researchers identified a growing population of the “newly needy.” As the Business Record reported that in December, Iowa respondents who reported the household’s primary source of income was a job or jobs of more than 35 hours a week was 74% pre-COVID, but dropped 8 points to 66% at the time of the survey. Those relying on unemployment payments as the primary source of household income rose from 1% pre-COVID to 11% at the time of the survey. Iowans who reported they could not cover one month of expenses increased from 18% pre-pandemic to 31% at the time of the survey. Thirteen and one half percent of respondents reported they were now visiting food pantries to meet household needs.